What Is Fibonacci Retracement? The Complete Forex Trading Guide
If you've ever watched a market rally hard, pull back, and then continue higher — only to miss the entry because you didn't know where to buy — you've already experienced what Fibonacci retracement is designed to solve.

Last Updated: May 6, 2026
TL;DR SUMMARY
Fibonacci retracement is a technical analysis tool that identifies probable support and resistance zones based on mathematical ratios. The Golden Pocket (61.8%–66%) represents the highest-probability reversal zone where institutional algorithms cluster. Always combine Fibonacci levels with price action confirmation and strict risk management to establish a structured, rule-based trading system.
Most traders spend years trying to guess where a pullback will end. They use gut feeling. They eyeball "round numbers." They wait for the move to confirm itself — by which point, they've missed 80% of it.
There's a better way. And it's been hiding in plain sight inside one of the most proven mathematical principles in human history.
In this guide, I'm going to break down exactly what Fibonacci retracement is, how to use it correctly in forex trading, the specific levels that matter most, and the common mistakes that cause traders to get it wrong even when they're drawing the lines in the right place. After years of mentoring traders one-on-one through Fibonacci-based strategies, I've seen every version of this mistake — and every version of the breakthrough that follows when the concept finally clicks.
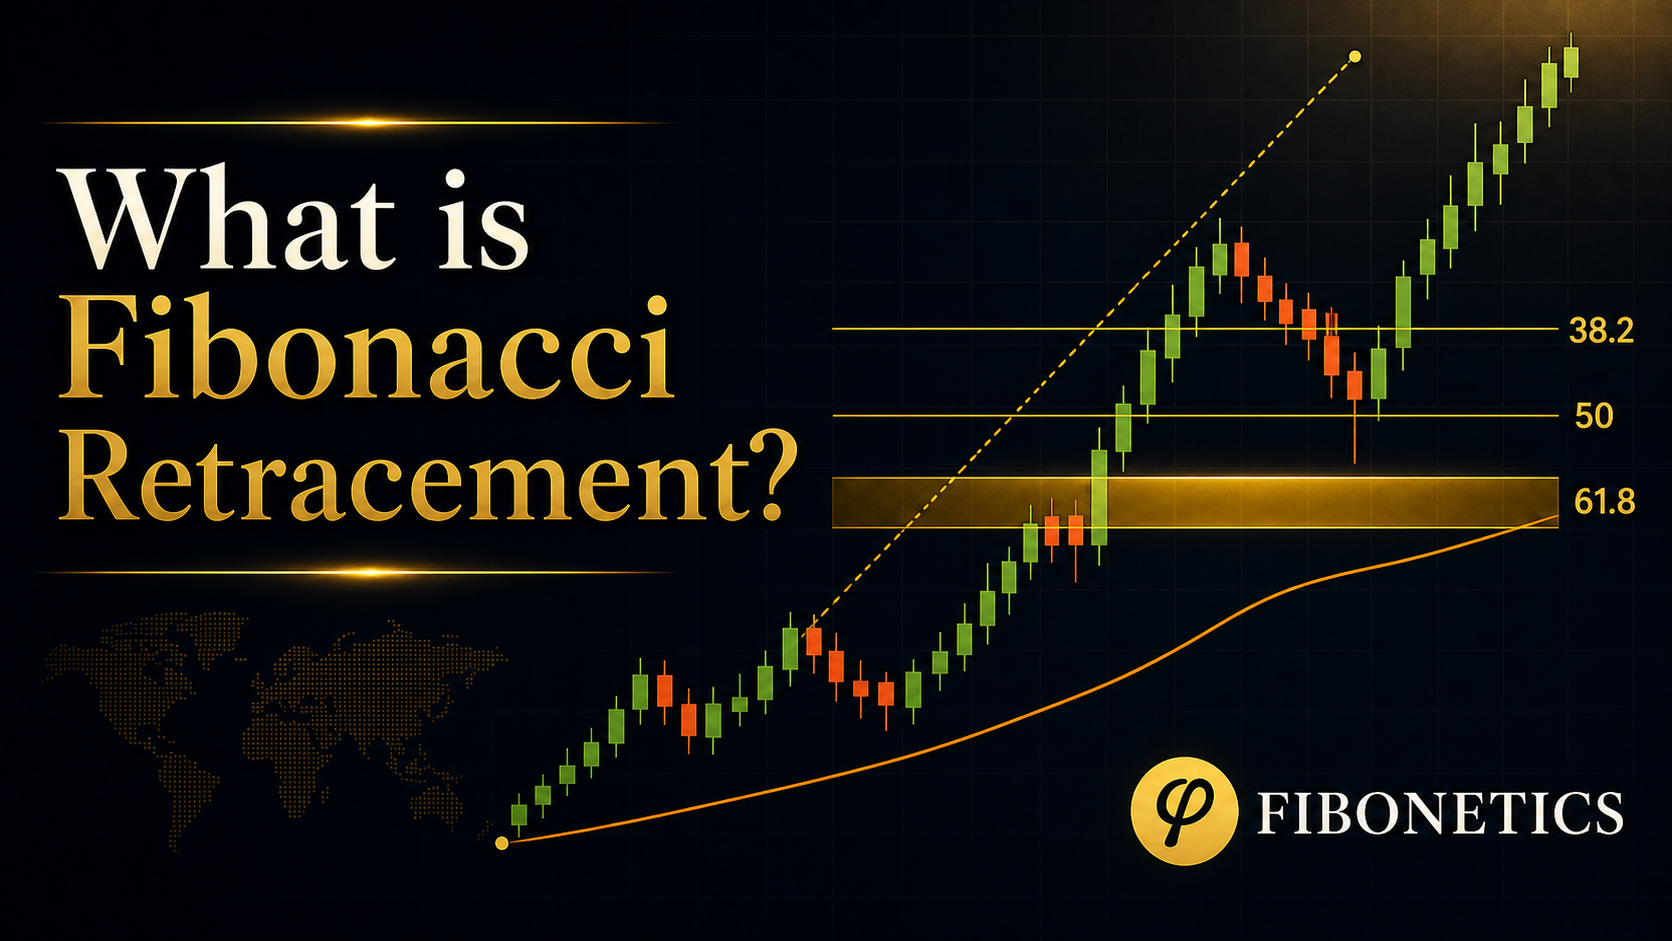
What Is Fibonacci Retracement in Forex Trading?
Fibonacci retracement is a technical analysis tool that uses horizontal lines to identify potential support and resistance levels where a price pullback is likely to pause or reverse before continuing in the original trend direction. These levels are derived from the Fibonacci sequence — a mathematical pattern where each number is the sum of the two before it — and correspond to key ratios: 23.6%, 38.2%, 50%, 61.8%, and 78.6%.
In practical trading terms: when a currency pair makes a strong directional move and then begins to pull back, Fibonacci retracement levels mark the zones where institutional traders, algorithms, and smart money tend to re-enter in the direction of the original trend. They are not magic lines. They are mathematical probability zones — and they work because millions of market participants are watching the same levels at the same time.
Why Does Fibonacci Retracement Change Everything for Forex Traders?
Here's the problem most traders face: they see a setup forming, but they have no logical framework for where to enter.
So they do one of three things:
- They enter too early, before the pullback is complete, and get stopped out
- They wait too long, entering after the move has already resumed, and chase the market
- They sit on their hands completely, paralysed by uncertainty, and miss the trade entirely
Fibonacci retracement eliminates that uncertainty. Instead of guessing, you're working from a mathematical framework that identifies the most probable zones where price will find support and resume its trend.
I work with traders every week who have been struggling for years. When I ask them to show me their entry logic, the most common answer I hear is "it looked like a good level."
That instinct isn't always wrong — but it's completely unreliable. A trader who says "it looked right" five times and is right twice has not found an edge. They've found luck. And luck runs out.
"Fibonacci retracement gives you something luck never can: a repeatable, rule-based system for identifying entries before the market confirms them." — Muneeb Khan
What Do The Numbers Show About Fibonacci Retracement?
| Metric | Data Source / Context |
|---|---|
| Retail forex traders who lose money | 90–95% (Broker risk disclosures) |
| Traders without a structured entry system | ~80% (Trading psychology surveys) |
| Win rate needed to profit at 1:2 R:R | 34%+ (Break-even analysis) |
| Price returning to 38.2%–61.8% zone | Occurs in majority of impulsive moves |
| Traders using confluence with Fibonacci | Higher win rate by est. 20–35% |
| Average retail account lifespan without a strategy | Less than 12 months (Broker internal data, FCA/ESMA widely cited) |
The numbers tell the same story every time: traders who operate without a structured, rule-based system for entries are not trading — they're gambling with extra steps. Fibonacci retracement is one of the most accessible and effective tools available for creating that structure.
How to Draw Fibonacci Retracement Correctly: Step-by-Step
- Step 1: Identify the dominant trend. Fibonacci retracement is a trend-following tool. In an uptrend, price makes higher highs and higher lows. In a downtrend, it makes lower highs and lower lows.
- Step 2: Identify significant swing high and swing low. These must be clear, distinct turning points. The quality of your drawing is dependent on the quality of your swing selection.
- Step 3: Draw the tool. In an uptrend, anchor at the swing low and drag to the swing high. In a downtrend, anchor at the swing high and drag to the swing low.
- Step 4: Identify key levels. Watch for price reactions at 23.6%, 38.2%, 50.0%, and 61.8%.
- Step 5: Wait for price to reach a key level — then look for confirmation. This is the step that separates profitable Fibonacci traders from losing ones. Do not enter the moment price touches a Fibonacci level. Wait for a confirmation signal — a pin bar, a bullish engulfing candle, a rejection wick — that shows the level is holding. Fibonacci tells you where to watch. Price action tells you when to act.
- Step 6: Place your stop loss and take profit logically. Place your stop loss 5-10 pips beyond the next Fibonacci level below your entry. Use Fibonacci extension levels (127.2%, 161.8%) as profit targets. For example, entry at 1.0957, stop below 1.0932 (around 1.0925), and target at 1.1193 gives a 1:7 R:R ratio.
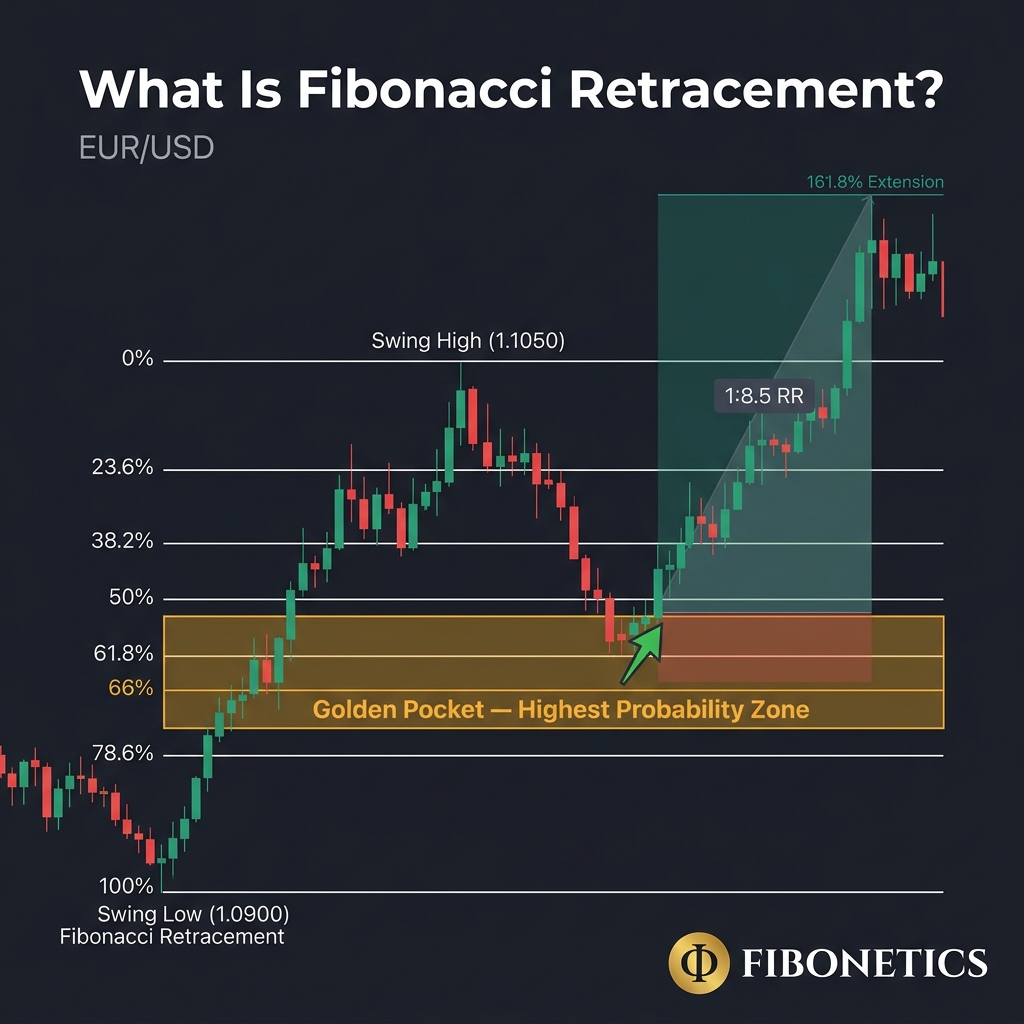
Let's use a live example. EUR/USD has been trending upward. The swing low formed at 1.0900 and the swing high printed at 1.1050 — a 150-pip move. Drawing Fibonacci retracement gives us:
| Retracement Level | Price | Significance |
|---|---|---|
| 23.6% | 1.1015 | Shallow pullback zone (strong momentum) |
| 38.2% | 1.0993 | Standard pullback (healthy trend continuation) |
| 50.0% | 1.0975 | Psychological midpoint (widely watched) |
| 61.8% | 1.0957 | The Golden Ratio. Golden Pocket begins here. |
| 66.0% | 1.0951 | Golden Pocket ends here. |
| 78.6% | 1.0932 | Deep pullback zone (still valid but weaker trend signal) |
Want to Learn the Full Fibonacci System 1-on-1?
Master Price Clusters, Symmetry Projections, Fibonacci Timing, and the 5-Star Setup — taught personally by Muneeb Khan via Zoom.
Book Your Free 15-Min Assessment Call →The Most Powerful Fibonacci Level: Understanding the Golden Pocket
The Golden Pocket is not just one level. It is a zone — the area between 61.8% and 66%. And it is the single highest-probability reversal zone on the entire Fibonacci tool.
Why? Two reasons that operate simultaneously.
Reason one: mathematical significance. The 61.8% level — also called the Golden Ratio — is derived by dividing any Fibonacci number by the number that follows it in the sequence (e.g., 89 ÷ 144 = 0.618). This ratio appears in nature, architecture, and human proportions with remarkable consistency. In financial markets, it represents the zone where a trend has retraced a "healthy" amount without signalling a full reversal.
Reason two: institutional clustering. This is the part most blogs never cover. Major institutional trading firms — banks, hedge funds, proprietary trading desks — have their algorithms programmed to execute at mathematically significant levels. When thousands of these algorithms are all triggered at the same zone, price reacts with extraordinary precision. The 61.8% level doesn't work because of mathematics alone. It works because it has become a self-fulfilling prophecy of institutional intent.
At Fibonetics, we call this the Institutional Confluence Zone — the point where the math, the algorithms, and the price action all align. When you enter at the Golden Pocket with confirmation, you are not guessing. You are trading alongside the largest, most sophisticated participants in the market.
What Are The 5 Biggest Mistakes Traders Make with Fibonacci Retracement?
- Drawing from the wrong swing points — Arbitrary swing selection leads to unreliable levels. The fix: always draw from the most significant recent swing high and swing low. If in doubt, zoom out to a higher timeframe and identify the clearest turning points first.
- Entering immediately on touch — Fibonacci tells you where to watch; price action tells you when to act. The fix: wait for a candlestick confirmation signal (pin bar, engulfing candle, rejection wick) to form at the level before placing your entry. Price can pierce through a Fibonacci level, sweep stops, and then reverse — this is called a liquidity sweep, and institutional algorithms do it deliberately.
- Placing stops at the level — Institutional algorithms hunt for retail stops clustering at Fib levels. The fix: place your stop 5-10 pips beyond the next Fibonacci level. If you enter at 61.8%, place your stop below 78.6%. This keeps you outside the sweep zone. It's liquidity hunting, not bad luck.
- Trading in ranging markets — Fibonacci loses effectiveness in sideways markets. The fix: before drawing any Fibonacci, confirm you are in a trending environment (higher highs/lows for uptrend, lower highs/lows for downtrend). No clear direction? Put the tool away.
- Ignoring confluence — A single level is one data point. The fix: build a minimum confluence requirement into your trading plan. At Fibonetics, we require at least two additional confluence factors (e.g. S/R, EMAs) before entering any Fibonacci-based trade.
FREE RESOURCE: The Fibonacci Confluence Checklist
Before I enter any trade at a Fibonacci level, I run through a 60-second checklist. It has kept me out of dozens of low-probability setups — and into the ones that actually move.
Download Free Checklist →How Risk Management Protects Every Fibonacci Trade You Take
Never risk more than 1–2% of your total trading account on any single trade. This sounds conservative — and it is, by design. At 2% risk per trade, you can survive 50 consecutive losses. At 10% risk, 10 consecutive losses end your account. In forex trading, losing streaks of 5-10 trades are completely normal even for profitable strategies.
Fibonacci retracement is uniquely powerful for risk management because it gives you logical, mathematically-derived stop placement and target levels.
Using our EUR/USD example:
- Entry at the Golden Pocket: 1.0957
- Stop loss below 78.6%: ~1.0925 (32-pip risk)
- Take profit at 161.8% extension: ~1.1193 (236-pip target)
- Risk-to-reward ratio: approximately 1:7
At that ratio, you only need to be right on 1 out of every 8 trades to be profitable. That is the power of trading with a logical framework. Always place your stop beyond a Fibonacci level — never at one.
How Fibonacci Retracement Connects to the Full Fibonetics Method
At Fibonetics, we layer Fibonacci levels with three filters to formulate a personalized Fibonacci trading strategy:
- Filter 1 — Trend Structure: Confirm the trend using higher-timeframe market structure. We only take retracement entries in the direction of the dominant trend on the 4-hour or daily chart — regardless of what the 15-minute chart shows.
- Filter 2 — Confluence Zones: Identify where a Fibonacci level overlaps with a clear support/resistance zone, a moving average, or a previous supply/demand area. The more factors that align, the higher the probability.
- Filter 3 — Price Action Confirmation: Wait for the market to show you it's respecting the level before committing capital. A rejection wick, a pin bar, or an engulfing candle is your confirmation signal.
The result is not a perfect strategy — no such thing exists in trading. What it produces is a consistent, rule-based approach that gives you a genuine edge over the 95% of traders who operate without a system. This shift — from instinct to system — is where consistent trading begins.
Fibonacci Retracement vs Fibonacci Extension
While Fibonacci retracement levels (23.6%–78.6%) identify potential entry points during a pullback, Fibonacci extension levels (127.2%, 138.2%, 161.8%, 261.8%) project where price may travel beyond the original swing high or low. Learning how Fibonacci extension levels work as profit targets is the second half of a complete trading system.
Update for 2026: As algorithmic trading volumes continue to increase, we are seeing the Golden Pocket zone (61.8%–66%) become even more precise across major forex pairs compared to previous years, making patience for this specific retracement more critical than ever.
🔑 KEY TAKEAWAYS
- ✓ Fibonacci retracement is a technical analysis tool that identifies probable support and resistance zones based on mathematical ratios.
- ✓ The key retracement levels are 23.6%, 38.2%, 50%, 61.8%, and 78.6%.
- ✓ The 61.8% Golden Ratio is the most significant level.
- ✓ The Golden Pocket (61.8%–66%) is the highest probability reversal zone where institutional algorithms cluster.
- ✓ Correct Fibonacci drawing requires selecting the most significant, clearly-defined swing high and swing low.
- ✓ Always wait for price action confirmation before entering.
- ✓ Place stops beyond the next Fibonacci level (not at your entry level) to stay outside liquidity sweep zones.
- ✓ Confluence is mandatory — a Fibonacci level aligned with S/R, a moving average, and a confirmation candle is exponentially more powerful.
Frequently Asked Questions
What is Fibonacci retracement and how does it work?
Fibonacci retracement is a technical analysis tool used by traders to identify probable support and resistance levels during a market pullback. It works by applying key ratios — 23.6%, 38.2%, 50%, 61.8%, and 78.6% — derived from the Fibonacci mathematical sequence to a price move's swing high and swing low. These ratios mark the zones where price is statistically likely to pause or reverse before resuming the original trend direction.
What is the most important Fibonacci retracement level?
The 61.8% retracement level — known as the Golden Ratio — is widely considered the most powerful level in Fibonacci trading. In practice, the zone between 61.8% and 66% (called the Golden Pocket) is the single highest-probability reversal area. This zone works because institutional algorithms and major trading firms are disproportionately active at this mathematical level, creating a self-fulfilling concentration of buy or sell orders.
How do you draw Fibonacci retracement correctly?
To draw Fibonacci retracement correctly: first confirm the dominant trend direction. In an uptrend, anchor your Fibonacci tool at the most significant recent swing low and drag it to the swing high. In a downtrend, reverse the process — anchor at the swing high, drag to the swing low. The accuracy of your drawing depends entirely on selecting the correct, clearly-defined swing points. Using arbitrary or minor swing points produces unreliable levels that the market has no reason to respect.
Is Fibonacci retracement reliable for forex trading?
Fibonacci retracement is a reliable tool when used correctly and in the right context. It works best in clearly trending markets with well-defined impulse moves and clean swing highs/lows. It becomes significantly more reliable when combined with confluence factors — such as an alignment with a support/resistance zone, a moving average, or a candlestick confirmation signal. Used in isolation or in ranging markets, its reliability decreases substantially. No technical tool works 100% of the time; risk management is what makes any strategy viable long-term.
What is the difference between Fibonacci retracement and Fibonacci extension?
Fibonacci retracement levels (23.6%–78.6%) are used to identify potential entry points during a pullback within a trend. Fibonacci extension levels (127.2%, 138.2%, 161.8%, 261.8%) are used to project where price may travel beyond the original swing high or low — making them ideal for setting profit targets. A complete Fibonacci trade setup uses retracement levels for entry and extension levels for exit, creating a logical, mathematically-structured trade from start to finish.
Can beginners use Fibonacci retracement?
Yes — Fibonacci retracement is one of the more beginner-accessible technical tools precisely because it is visual, rule-based, and teachable. The key challenge for beginners is learning to correctly identify swing highs and lows, and developing the patience to wait for confirmation signals at Fibonacci levels before entering. These are skills that develop with practice and guided repetition. Starting on a demo account and focusing on one currency pair (EUR/USD is recommended for beginners) makes the learning curve significantly more manageable.
Why does Fibonacci retracement work in the markets?
Fibonacci retracement works for two reinforcing reasons. First, the ratios reflect natural mathematical relationships found consistently across human behaviour, natural phenomena, and financial markets. Second — and more practically — they work because of self-fulfilling institutional activity. Thousands of trading algorithms and professional traders use these exact levels, which concentrates buy and sell orders at Fibonacci zones. When that many market participants are acting at the same price level simultaneously, the level becomes real regardless of its mathematical origin.
Conclusion
Fibonacci retracement is not a crystal ball. It doesn't predict the future — no tool does. What it does is give you a mathematically-grounded, repeatable framework for identifying the highest-probability zones in any trending market. It takes the guesswork out of entries. It gives your stop losses a logical anchor. It connects your profit targets to the same mathematical structure your entry came from.
The traders who use it successfully are not smarter than the ones who don't. They're more structured. They've replaced "this looks right" with "this level aligns with the Golden Pocket, a previous resistance zone, and a pin bar confirmation — I have a setup." That shift — from instinct to system — is where consistent trading begins.
If everything in this guide resonated with you — if you've been placing trades on feel and losing money, or drawing Fibonacci incorrectly without realising it — then you already know more than you did an hour ago. The next step isn't to read another article.
Trading financial instruments involves substantial risk. The content on Fibonetics.com is for educational purposes only and not financial advice.
Share this article
Ready to Apply This? Let's Talk.
Book a free 15-minute strategy call to identify your trading weaknesses and see how a structured Fibonacci framework applies to your trading.
Book My Free 15-Minute Strategy Call →