Fibonacci Extensions Explained: How to Set Profit Targets Like a Professional
You entered a trade perfectly, but closed it too early. Fibonacci extensions give you mathematically grounded profit targets, so you stop guessing and start exiting like a professional.

Last Updated: May 6, 2026
TL;DR SUMMARY
Fibonacci extensions project where price is likely to travel beyond the original swing — giving you mathematically grounded profit targets before you enter a trade. The most important target is the 161.8% level (Golden Extension) where institutional algorithms often book profits. Combining a conservative target at 127.2% and a primary target at 161.8% creates a highly effective tiered exit strategy.
You entered a trade. The setup was perfect — the trend was clear, the pullback was clean, and your entry was at a textbook Fibonacci retracement level. Price moved exactly where you expected.
Then you closed the trade too early.
Maybe you panicked at resistance. Maybe you grabbed a 20-pip profit and watched the pair move another 150 pips without you. Maybe you just had no idea where the trade was supposed to end — so you guessed.
That's not a trading problem. That's a targeting problem. And it's costing most retail traders more money than their bad entries ever will.
After years of working with traders one-on-one using Fibonacci-based frameworks, one pattern keeps showing up: traders obsess over their entries but treat profit-taking like a coin flip. Fibonacci extensions solve that problem permanently — if you know how to use them correctly.
This guide will show you exactly what Fibonacci extensions are, which levels actually matter, and how to apply them step-by-step on a real trade. By the end, you'll have a structured, rule-based method for setting profit targets the way professional traders do.
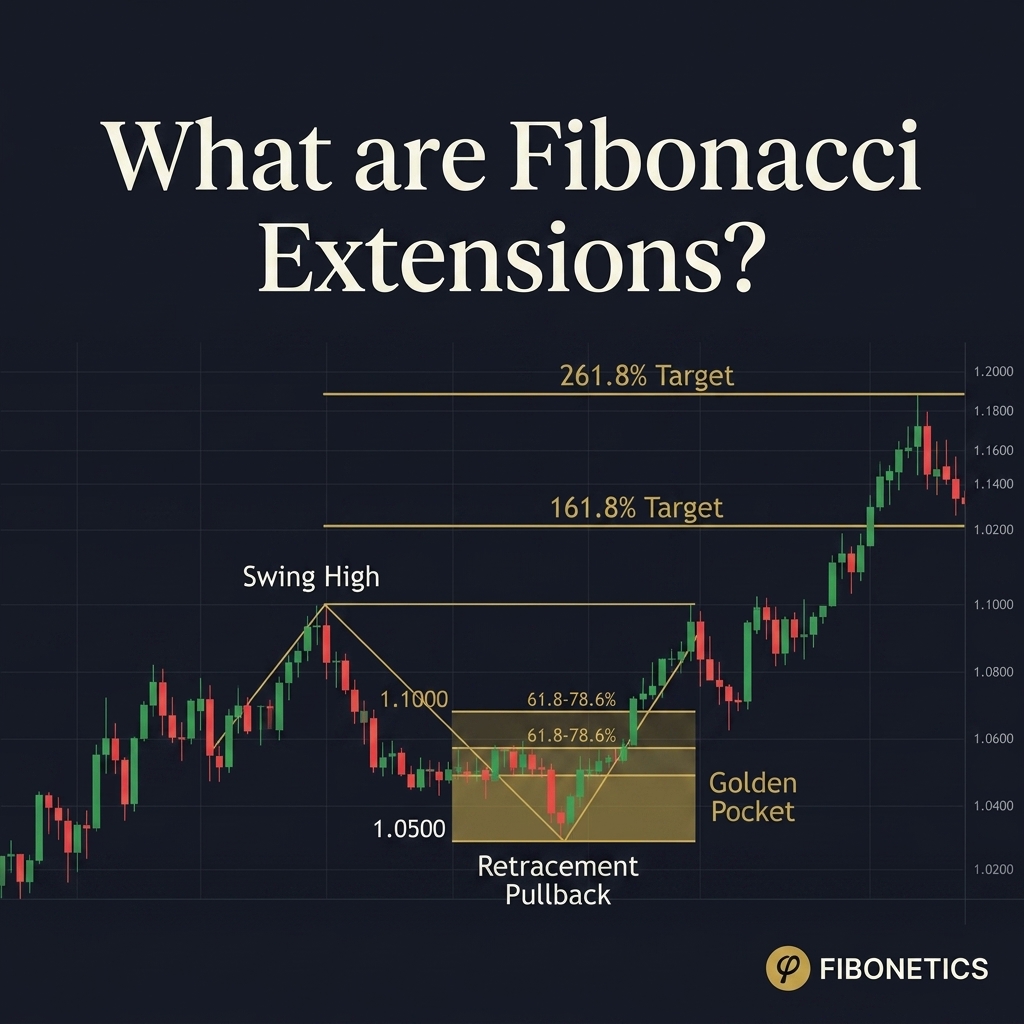
What Are Fibonacci Extensions in Forex Trading?
Fibonacci extensions are price projection levels derived from the Fibonacci sequence that traders use to identify where a trending move is likely to end after a retracement.
Unlike Fibonacci retracements — which measure how far a pullback will go — extensions measure how far the next impulse wave will travel beyond the original swing high or low. They give you mathematically grounded profit targets, not guesses.
The key extension levels are 127.2%, 138.2%, 161.8%, and 261.8%. These numbers come from the same mathematical ratios found throughout nature and financial markets: the golden ratio (1.618) and its derivatives. The most watched level by institutional traders is the 161.8% extension, sometimes called the "golden extension" — the point where price has moved 1.618 times the distance of the initial swing move beyond the retracement.
To be precise about terminology: some platforms label these as "Fibonacci extensions" and others label them as "Fibonacci projections" or "external retracements." The concept is the same. At Fibonetics, we use the term Fibonacci extensions specifically to describe forward-projected targets placed beyond the original swing point — distinguishing them from retracement levels, which sit within the original move.
Extensions don't guarantee price will stop at any specific level. No tool in trading does. But they identify the zones where institutional algorithms are programmed to take profit — and when thousands of algorithms act at the same price simultaneously, those levels become self-fulfilling. That's the edge.
Why Fibonacci Extensions Are the Difference Between Profit and Loss
Think about what happens when you trade without a defined profit target.
You enter at the right price. Price moves your direction. You watch it for a while. You feel good. Then it stalls at a random resistance level you didn't mark, starts pulling back, and you close for 15 pips — even though the original move had 80 more pips to give.
I see this every week with traders who come to me. The trade wasn't wrong. The exit was. And an early exit on a winning trade is just as damaging as a losing trade — because it kills your risk-to-reward ratio and forces you to win at an unrealistically high rate just to stay profitable.
Here's what changes when you use Fibonacci extensions properly: your trade has a destination before you enter it. You know the 127.2% level is the conservative target, the 161.8% level is the primary target, and the 261.8% level is the stretch target for a trend continuation move. You place your take-profit orders before the trade is open. You don't sit in front of the screen second-guessing yourself.
This is the psychological difference between a structured trader and a reactive one. The structured trader makes decisions when they're calm, with a full view of the chart. The reactive trader makes decisions in the middle of a live trade, under pressure, with money on the line. Guess which one consistently outperforms.
The Numbers: What Fibonacci Extensions Actually Look Like
| Extension Level | Relationship to Original Move | Common Use |
|---|---|---|
| 100% | Equal move projection | Minimum target in momentum moves |
| 127.2% | Shallow extension | Conservative first target (partial close) |
| 138.2% | Moderate extension | Intermediate target in ranging markets |
| 161.8% | Golden Extension (Golden Ratio) | Primary target in trending markets |
| 200% | Double the original move | Strong trend continuation signal |
| 261.8% | Deep extension | Target in high-momentum breakout moves |
The 161.8% extension level is the most respected across all major forex pairs. When price reaches this zone with momentum, it often signals the completion of an impulse wave — which means a reversal or at least a significant pullback is incoming. Closing at least part of your position here is a professional standard, not a beginner's shortcut.
The 127.2% level matters too, especially in choppier market conditions. In my experience working with traders across EUR/USD, GBP/USD, and USD/JPY, the 127.2% level catches many "good enough" moves that never quite reach 161.8%. Using it as a partial close target keeps you from giving back gains.
Want to Learn the Full Fibonacci System 1-on-1?
Master Price Clusters, Symmetry Projections, Fibonacci Timing, and the 5-Star Setup — taught personally by Muneeb Khan via Zoom.
Book Your Free 15-Min Assessment Call →How to Use Fibonacci Extensions in Forex Trading: Step-by-Step
Here's how to apply Fibonacci extensions on a real trade — no vagueness, no theory, just the exact process.
-
Step 1: Identify a completed swing move (3 points are
required). You need three points to draw an extension: a swing low (Point A), a swing high (Point
B), and the start of the retracement (Point C). For an uptrend, this means: the swing low → the swing
high → the pullback level where price has found support.
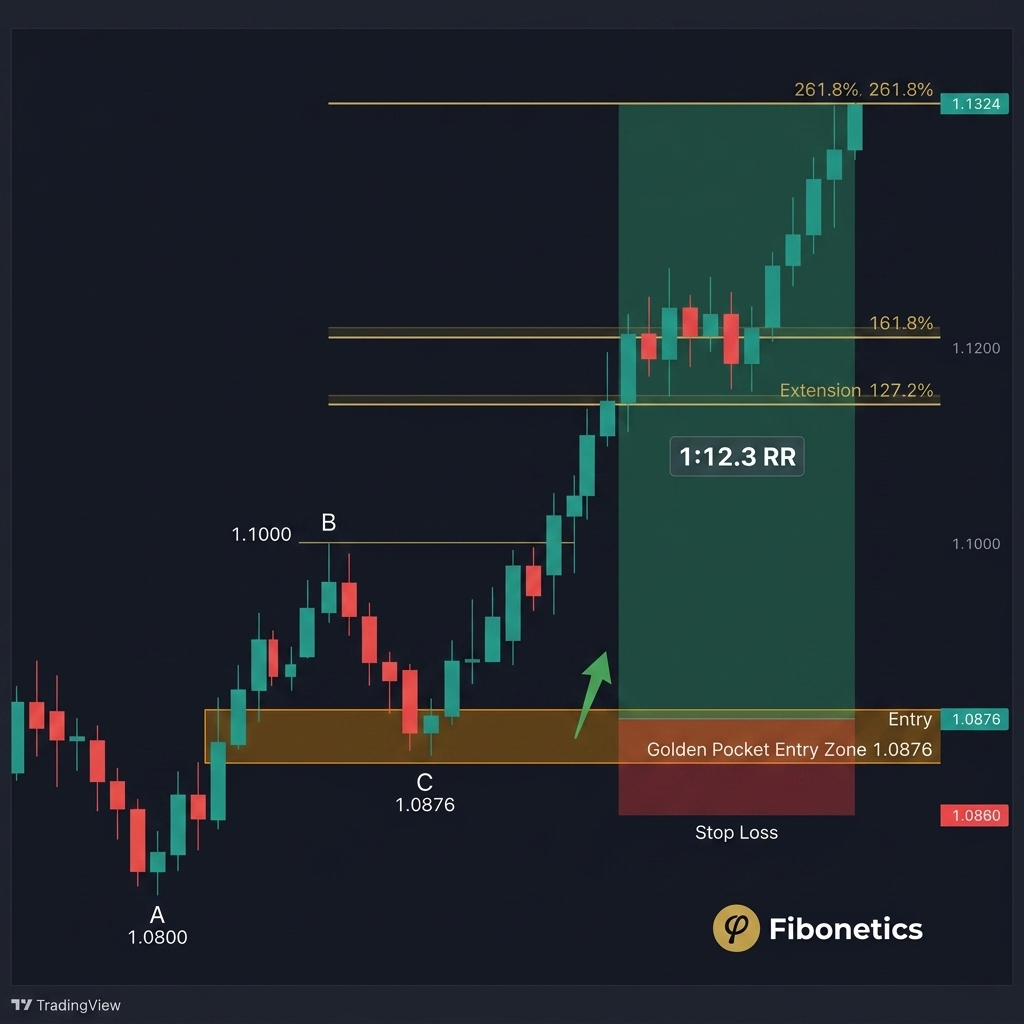
Example: EUR/USD has been in an uptrend. Price swings from a low at 1.0800 (Point A) to a high at 1.1000 (Point B) — a 200-pip impulse move. Price then pulls back to the 61.8% retracement level at 1.0876 (Point C) and begins to stall, showing bullish candlestick signals. - Step 2: Draw the Fibonacci extension from A to B to C. In your trading platform (MT4, MT5, TradingView), use the Fibonacci extension or "Fib Retracement Extension" tool. Click Point A (1.0800), drag to Point B (1.1000), then anchor Point C at the retracement low (1.0876). The platform automatically plots the extension levels beyond Point B.
-
Step 3: Calculate the key extension levels. With a 200-pip
initial move (A to B) and Point C at 1.0876, your extension levels project as follows:
• 127.2% extension: 1.1000 + (200 × 0.272) = approximately 1.1054
• 138.2% extension: approximately 1.1076
• 161.8% extension: 1.1000 + (200 × 0.618) = approximately 1.1124
• 261.8% extension: approximately 1.1324 (only valid in strong trend continuation) - Step 4: Set your take-profit orders at the extension levels. This is where structure beats emotion. Place your first take-profit at the 127.2% level (1.1054) to lock in gains. Move your stop loss to breakeven once price clears that level. Let the remaining position run toward the 161.8% level (1.1124) as your primary target.
- Step 5: Confirm with confluence before entering. A Fibonacci extension level alone is never enough. Before you enter the trade at Point C, look for confluence — the alignment of your retracement level with at least one additional factor, like the Golden Pocket zone or a bullish candlestick pattern.
The more factors that align, the higher the probability of the move completing to your target.
💡 Free Resource: Fibonacci Extension Target Calculator
Before you place your next trade, run the numbers. Here's how Fibonetics traders calculate extension levels in under 60 seconds:
Formula:
Swing Size = Point B − Point A
Extension Level = Point B + (Swing Size ×
Extension Ratio)
For a downtrend, reverse the formula: Point B − (Swing Size × Extension Ratio). This is the exact calculation framework used in the Fibonetics Fibonacci Trade Checklist — a pre-entry tool that walks you through swing identification, retracement confirmation, extension calculation, and risk sizing before you commit a single dollar to a trade. Download the Free Fibonacci Trade Checklist and go through it on your next setup before you hit Buy or Sell.
The 4 Biggest Mistakes Traders Make with Fibonacci Extensions
- Mistake 1: Using Extensions Without a Clear Retracement First — Extensions only work when they're anchored to a confirmed, completed swing move with a clear pullback. If you try to project extensions from a mid-trend candle or a poorly defined swing point, your levels will be meaningless. The three-point structure (A → B → C) is not optional — it's the foundation. What to do instead: Wait for price to clearly form a swing high or low, then wait for a pullback that reaches at least the 38.2% retracement level before drawing extensions. Patience in setup identification pays dividends in target accuracy.
- Mistake 2: Targeting Only the 161.8% and Ignoring the 127.2% — Many traders learn about the golden extension at 161.8% and make it their only target. The problem is that markets don't always deliver textbook 161.8% extensions — especially in choppy or ranging conditions. Going "all-in" on 161.8% while ignoring the 127.2% level means you'll often watch a winning trade reverse before reaching your target. What to do instead: Use a tiered exit strategy. Close 50% of your position at 127.2%, move your stop to breakeven, and let the remaining half run to 161.8%. This approach guarantees a profitable trade even if price doesn't reach the primary target.
- Mistake 3: Ignoring the Direction of the Higher Timeframe Trend — A Fibonacci extension drawn against the dominant trend is a low-probability trade — regardless of how clean the setup looks on the 1-hour chart. If EUR/USD is in a clear downtrend on the daily chart, extension targets for a "buy" setup on the 15-minute chart are unreliable. Counter-trend moves rarely complete to the 161.8% level. What to do instead: Always check the daily chart before drawing extensions on lower timeframes. Only project extension targets in the direction of the higher timeframe trend. Counter-trend scalps should use tighter targets (50% or 61.8% retracements) rather than full extensions.
- Mistake 4: Moving the Take-Profit Target Mid-Trade — This is the most psychologically damaging mistake — and the most common. Price is 10 pips from your 127.2% target when a news candle pushes price away. Instead of letting your system play out, you close early. Or price is approaching 161.8% and you move the target to 261.8% out of greed. Both are account-damaging habits rooted in emotional trading, not strategy. What to do instead: Set your take-profit levels before entering the trade — then leave them alone. The rule is simple: change your trade plan only when market conditions fundamentally change (structure break, major news event), never because of in-trade emotion.
FREE RESOURCE: The Fibonacci Confluence Checklist
Before I enter any trade at a Fibonacci level, I run through a 60-second checklist. It has kept me out of dozens of low-probability setups — and into the ones that actually move.
Download Free Checklist →How Fibonacci Extensions Enhance Your Entire Trading Approach
Fibonacci extensions don't exist in isolation. They're one piece of a complete framework — and understanding how they connect to the broader Fibonacci system is what separates traders who know about Fibonacci from traders who actually profit from it.
Here's how the framework fits together. The retracement levels (23.6%, 38.2%, 50%, 61.8%, 78.6%) tell you where to enter. The extension levels (127.2%, 138.2%, 161.8%, 261.8%) tell you where to exit. The Golden Pocket — the zone between the 61.8% and 66% retracement — is the highest-probability entry zone. The 161.8% extension is the highest-probability exit zone. Together, they create a complete, structured trade with a defined entry, a defined stop, and a defined target.
Why do these levels work? Because institutional algorithms are programmed to execute orders at these exact ratios. When a major bank's trading algorithm is set to take profit at the 161.8% extension level on EUR/USD, and thousands of similar algorithms are doing the same thing, the resulting order flow creates real price action at that level. The Fibonacci levels become self-fulfilling — not because of math magic, but because of market participation.
At Fibonetics, this is what we call the Institutional Confluence Layer. It's not enough to draw lines on a chart. You need to understand why price respects those lines — and that understanding comes from recognizing that Fibonacci levels are liquidity maps. They show you where the money is clustered.
Risk Management: The Rule That Protects Everything You've Built
Setting a profit target is only half the equation. The other half is knowing exactly how much you're risking to reach it — and making sure that ratio makes mathematical sense before you ever enter the trade.
The Fibonetics standard is a minimum 1:2 risk-to-reward ratio. This means: for every pip you risk, you target at least two pips of gain. At 1:2 R:R, you only need to be right 34% of the time to be profitable. Read that again. You can lose two out of every three trades and still grow your account — if your winners are consistently twice the size of your losers.
Here's how this applies to the Fibonacci extension framework:
- The 1–2% Rule: Never risk more than 1–2% of your total account on a single trade. If your account is $5,000, your maximum risk per trade is $50–$100. At 2% risk per trade, you can sustain 50 consecutive losing trades and still have capital left to recover. At 10% risk per trade, 10 losses end your account.
- Stop Loss Placement: Place your stop loss 3–5 pips beyond the most recent Fibonacci retracement level that price has respected. In our EUR/USD example, if Point C is at the 61.8% retracement (1.0876), your stop goes at approximately 1.0868–1.0870 — just below the 66% retracement level. This placement is logical and market-based, not arbitrary.
- Calculating Position Size: Once you know your entry (1.0876), your stop (1.0870), and your first target (1.1054), the math becomes automatic. Your stop distance is 6 pips. Your first target distance is 178 pips. That's a 1:29 risk-to-reward ratio on the first partial close alone — and your stop is inside a logical structure.
The traders who consistently break risk rules — who risk 5% because "the setup looks so good" — are the same traders who wipe accounts during drawdown periods. Discipline in position sizing is not a personality trait. It's a survival skill.
The Professional Edge: Why Most Traders Never Discover This About Fibonacci Extensions
Here's something the generic trading blogs won't tell you — because they've never actually traded.
Most retail traders draw Fibonacci from the first obvious swing point they can find. Professional traders spend considerably more time identifying the correct swing points — the ones that align with institutional order flow. The difference is in how you define "swing high" and "swing low."
A valid swing high is not just the highest candle on your chart. It's a candle (or candle cluster) where price made a decisive high, left unfilled gaps or imbalance on both sides, and created a zone of institutional selling pressure. Similarly, a valid swing low is where institutional buyers stepped in with force — visible through high-volume engulfing candles, sharp V-shaped reversals, or clear break-of-structure signals.
When you anchor your Fibonacci extensions to those swing points — rather than random local highs and lows — the accuracy of your extension targets increases dramatically. The 161.8% level starts aligning with prior structural levels, order blocks, and round number confluences naturally. That's not a coincidence. It's the market revealing its own architecture.
This is the 10% that separates the Fibonetics approach from generic Fibonacci content. It's not about the tool — it's about understanding what the tool is measuring.
🔑 KEY TAKEAWAYS
- ✓ Fibonacci extensions project where price is likely to travel beyond the original swing — giving you mathematically grounded profit targets before you enter a trade.
- ✓ The three essential extension levels are 127.2% (conservative target), 161.8% (primary target), and 261.8% (trend continuation target).
- ✓ To draw extensions correctly, you need three anchor points: the original swing low (A), swing high (B), and the pullback level (C).
- ✓ Always use a tiered exit strategy — close part of your position at 127.2%, move your stop to breakeven, and let the rest run to 161.8%.
- ✓ Extension targets are significantly more reliable when the 161.8% extension aligns with a prior structural level, round number, or order block — always look for confluence.
- ✓ Never trade extensions against the higher timeframe trend. Use extension targets only in the direction the daily chart supports.
- ✓ Risk management is non-negotiable: set your stop loss at a logical Fibonacci level, risk 1–2% of your account, and calculate position size before entering.
- ✓ Fibonacci levels work because institutional algorithms cluster orders at these ratios — making the levels self-fulfilling when thousands of participants act at the same price simultaneously.
Frequently Asked Questions
What is a Fibonacci extension in forex trading?
A Fibonacci extension in forex trading is a forward-projected price level that shows where a trend is likely to resume after a pullback, expressed as a percentage beyond the original swing move. The most important levels are 127.2%, 138.2%, 161.8%, and 261.8%. They are used primarily as profit target zones, telling the trader where to close a trade rather than where to enter one.
How is a Fibonacci extension different from a Fibonacci retracement?
Fibonacci retracements measure how far a pullback goes within an existing move — they sit between the swing high and swing low. Fibonacci extensions project beyond the original swing point, measuring how far the next impulse move is likely to travel. In practice: use retracements to find your entry, use extensions to find your exit.
Which Fibonacci extension level is the most important?
The 161.8% extension level — sometimes called the golden extension — is the most widely watched and most reliable level across all major forex pairs. It represents the golden ratio (1.618) applied to market structure, and it's the level where institutional algorithms most commonly book profits. The 127.2% level serves as an important secondary target for partial position closure.
Can Fibonacci extensions be used on all timeframes?
Yes. Fibonacci extensions work on any timeframe — from the 15-minute chart to the weekly chart. However, extension levels drawn on higher timeframes carry more weight and are respected by more market participants. A 161.8% extension on the daily chart is significantly more powerful than the same level on a 5-minute chart. At Fibonetics, we recommend confirming your extension targets on at least one timeframe above your entry timeframe.
Is Fibonacci extensions trading good for beginners?
Fibonacci extensions are absolutely accessible to beginners, provided you understand the foundational concepts first — particularly Fibonacci retracements and basic swing high/low identification. The step-by-step process in this article is designed so that a new trader can follow it on a practice account from day one. That said, the nuances of selecting high-quality swing points take time and deliberate practice to develop.
Do Fibonacci extensions work in all market conditions?
Fibonacci extensions are most reliable in trending markets with clear impulse-pullback structure. In range-bound or choppy markets, extension targets are less predictable because price lacks the directional momentum needed to complete a full impulsive move. Before drawing extensions, always confirm that the higher timeframe trend is clear and that the retracement has found genuine support or resistance — not just a random pause.
What happens if price blows through a Fibonacci extension level?
When price closes decisively beyond a major extension level (particularly the 161.8%), it often signals the beginning of a trend continuation phase rather than a reversal. In these cases, the 261.8% extension becomes the next logical target. This is why the tiered exit strategy matters — you've already closed part of your position at 127.2% and locked in profit, so you can afford to let the remaining portion run toward the higher extension.
Conclusion
Fibonacci extensions don't make trading easy. Nothing does. But they make it structured — and that structure is what separates traders who grow their accounts from traders who spin their wheels for years, wondering why their entries are good but their results aren't.
The pattern is almost always the same: great entry, unclear exit, emotional close, missed profit. Fibonacci extensions fix the second and third parts of that equation by giving you an objective destination for every trade before you take it.
The traders who succeed aren't necessarily the ones with the highest IQs or the fastest computers. They're the ones with a clear plan, consistent execution, and the discipline to let their structure do the work. Knowledge alone doesn't build accounts. Applied knowledge does.
If what you've read today resonates with where you are right now in your trading journey, the next step isn't to read another article. It's to apply this — with a system, and ideally with guidance.
Forex trading involves significant risk of loss. Fibonacci extension levels are analytical tools, not guarantees of future price movement. Always apply proper risk management and trade with capital you can afford to lose. Past performance does not guarantee future results.
Share this article
Ready to Trade Fibonacci Extensions with a Personalized Strategy?
Book a free 15-minute strategy call to identify your trading weaknesses and see how a complete Fibonacci-based framework applies to your trading.
Book My Free 15-Minute Strategy Call →