How to Use Fibonacci Confluence Zones: The Method That Separates Consistent Traders from Everyone Else
A Fibonacci level alone is probability — not certainty. Learn how to turn that probability into consistent profit by understanding technical confluence on Gold (XAUUSD).

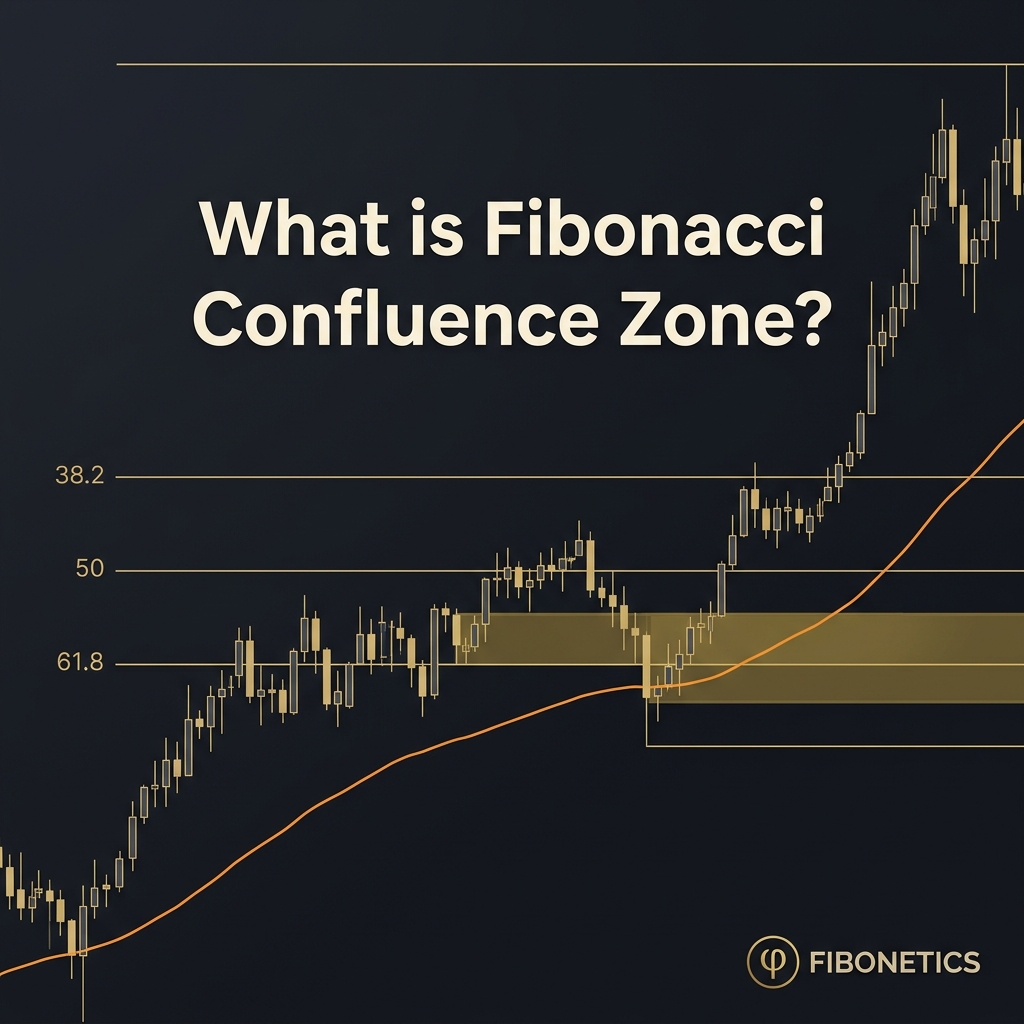
What Are Fibonacci Confluence Zones in Trading?
A Fibonacci confluence zone is a price area on a chart where two or more independent technical signals overlap at or near the same level - with at least one of those signals being a Fibonacci retracement or extension level. When a Fibonacci ratio aligns with a support/resistance zone, a moving average, a candlestick pattern, or a trend direction filter, it creates a high-probability reversal area that institutional algorithms are programmed to respect.
Fibonacci retracement is a technical analysis tool that measures how far a market has "pulled back" from a recent move. The key levels - 23.6%, 38.2%, 50%, 61.8%, and 78.6% - are mathematical ratios derived from the Fibonacci sequence, a number series where each number is the sum of the two before it (1, 1, 2, 3, 5, 8, 13, 21...). The ratio between any consecutive numbers approaches 0.618, which is the foundation of the famous "Golden Ratio."
A single Fibonacci level is a zone of interest. A confluence zone - where Fibonacci aligns with structure, trend, and confirmation - is a zone of probability. The difference between these two things is the difference between breakeven and consistency.
At Fibonetics, we call this the Institutional Confluence Framework: the discipline of only entering trades where at least three independent factors point to the same price area before touching capital.
Why Fibonacci Confluence Zones Are the Difference Between Profit and Loss
Here's the hard truth most trading courses skip: Fibonacci levels don't work because of magic. They work because institutions make them work.
I see this every week with traders who come to me frustrated. They bought a Fibonacci course, started marking levels, and got crushed within the first month. When I look at their trade history, the problem is obvious - they were trading levels, not confluence zones.
A standalone Fibonacci level on Gold can fail for many reasons: a liquidity sweep above a key high, a news event, a shift in institutional order flow. But when that same Fibonacci level sits at a former resistance zone, aligns with the 200 EMA, and produces a bullish pin bar candle - the odds shift dramatically.
Think of Fibonacci confluence zones like a road intersection. One road is useful. The intersection - where two roads cross - is where the highest traffic concentrates. Institutions aren't trading blind. They're watching the same intersections you are. When you learn to identify these zones before price arrives, you're not chasing the market. You're waiting at the destination.
Gold (XAUUSD) is one of the best markets to apply this method because it is a deeply institutional market. Central banks, sovereign wealth funds, and algorithmic trading desks move Gold in measured, structured waves. Those waves consistently respect Fibonacci structure - particularly the Golden Pocket - making XAUUSD one of the most Fibonacci-responsive instruments in the world.
How to Use Fibonacci Confluence Zones on XAUUSD: Step-by-Step
This is the method. Follow it precisely and you'll identify higher-probability trade setups on Gold that most traders completely miss.
Step 1: Identify the Trend Direction on the Higher Timeframe
Before drawing anything, determine the dominant trend on the Daily or 4-Hour chart. For XAUUSD, the Daily chart is your North Star. If price is making higher highs and higher lows, you're in an uptrend and you're looking for long (buy) setups on retracements only. Never trade against the higher timeframe trend when using Fibonacci confluence - you'll be fighting institutional order flow.
Step 2: Identify the Most Recent Clean Swing High and Swing Low
A swing high is a candle with a lower high on both sides. A swing low is a candle with a higher low on both sides. Accuracy matters here - choosing the wrong swing points is the #1 technical error traders make with Fibonacci. For Gold on the 4-Hour chart:
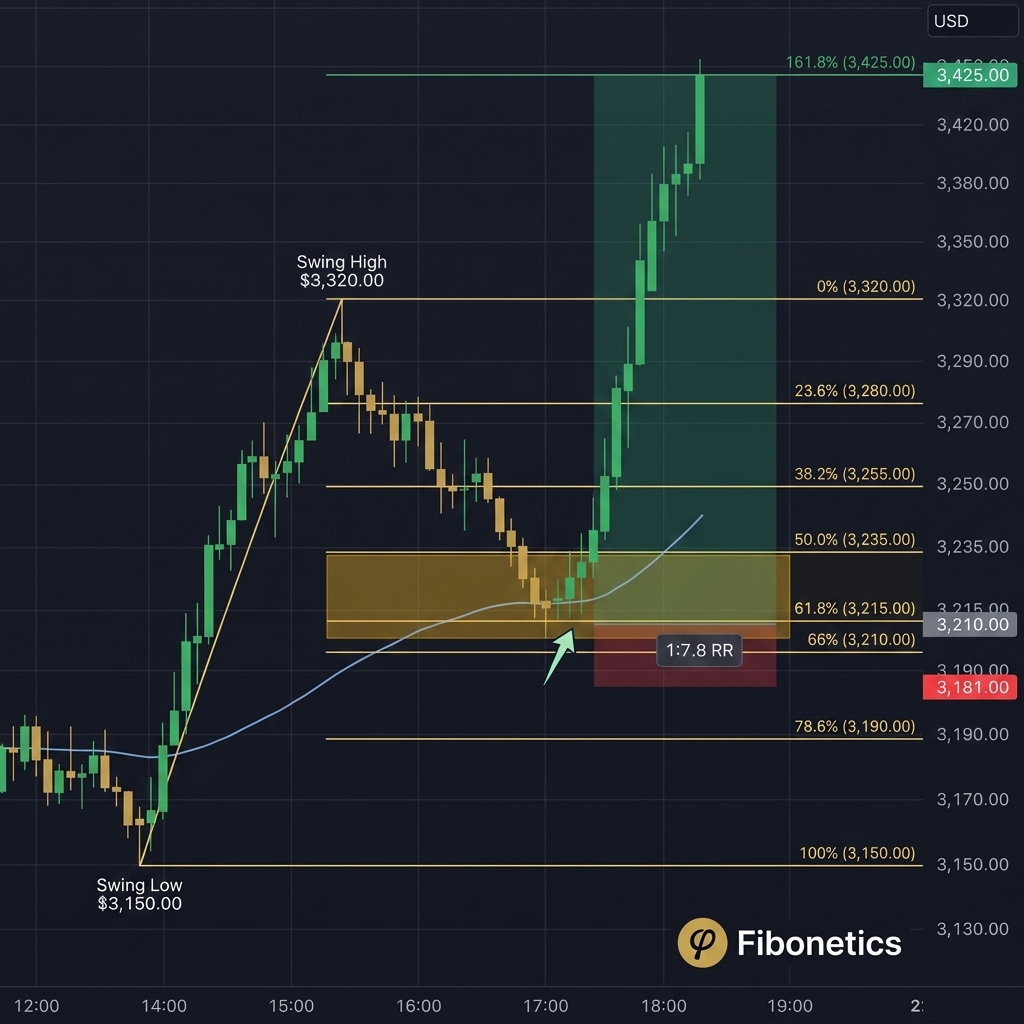
Let's say XAUUSD recently made a swing low at $3,150 and a swing high at $3,320 before pulling back. That's your range.
Step 3: Draw the Fibonacci Retracement Tool
In an uptrend, draw from the swing low to the swing high - bottom to top. This gives you the following key levels:
| Level | XAUUSD Price | Market Significance |
|---|---|---|
| 23.6% | $3,279 | Shallow pullback zone |
| 38.2% | $3,255 | Standard shallow correction |
| 50% | $3,235 | Psychological midpoint |
| 61.8% | $3,215 | Golden Pocket Start |
| 66% | $3,208 | Golden Pocket End |
| 78.6% | $3,186 | Deep pullback zone |
Step 4: Identify Confluence Factors at Each Level
Now look at each level and ask: What else is here? Check for:
- Previous support/resistance levels - Was $3,215 a previous resistance that's now flipped to support?
- Moving averages - Is the 50 EMA or 200 EMA sitting near the Golden Pocket on the 4H or 1H chart?
- Volume profile - Is there a high-volume node anchored near $3,215 that acted as price magnetism?
- Trendline alignment - Does an ascending trendline from a previous swing structure pass through the $3,208–$3,215 zone?
If the Golden Pocket ($3,208–$3,215) aligns with the 200 EMA AND a previous resistance level - you have three confluences stacked. That is your zone.
Step 5: Wait for Price Action Confirmation
Never enter the moment price touches a confluence zone. Wait for the market to show you it intends to reverse. The two most reliable confirmation signals on Gold:
- Bullish Pin Bar (Hammer): A candle with a long lower wick, rejecting the zone and closing near the high. This tells you sellers pushed price down but buyers overwhelmed them.
- Bullish Engulfing: A green candle that completely engulfs the previous red candle. This signals a definitive shift in momentum at the level.
Step 6: Place Your Trade with Defined Risk
| Trade Element | Placement Rule | XAUUSD Level |
|---|---|---|
| Entry | Close of confirmation candle | Market Price |
| Stop Loss | Beyond 78.6% level | $3,181 |
| Take Profit 1 | 127.2% Extension | $3,366 |
| Take Profit 2 | 161.8% Extension | $3,425 |
Master Fibonacci Confluence 1-on-1
Learn the exact framework we use to identify high-probability Gold setups. Structured mentorship with Muneeb Khan.
Book Your Free 15-Min Call →The 4 Biggest Mistakes Traders Make with Fibonacci Confluence Zones
- Mistake 1: Drawing from the Wrong Points. Picking arbitrary candle wicks rather than true swing highs and lows. Always use the Daily chart to identify the major swing structure first.
- Mistake 2: Trading Every Level, Not Just Confluence Zones. Entering at the 23.6% with no secondary confluence. A lonely Fibonacci level is not a setup - it's a guess.
- Mistake 3: Entering Before the Confirmation Candle Closes. FOMO is expensive. Wait for the candle to close to avoid being stopped out by continuation candles.
- Mistake 4: Ignoring the Macro Trend. Trading a long setup when the Daily trend is bearish. Trend is senior. Fibonacci is junior.
How Fibonacci Levels Explain Gold's Most Powerful Reversal Zones
Gold (XAUUSD) moves in institutional waves - and those waves consistently respect Fibonacci structure because the algorithms that drive 60–70% of Gold's daily volume are programmed to respond to these ratios.
The Golden Pocket on Gold (61.8%–66%) regularly produces the cleanest, most reliable reversal structures of any major instrument. When you add a second confluence factor - a key daily level, a 200 EMA, a trendline - you're identifying the exact zone where institutional accumulation is occurring.
A Fibonacci level alone is never enough. Always confirm with price action, trend direction, and at least one additional confluence factor before entering. This is non-negotiable.
Risk Management: The Rule That Protects Everything You've Built
No trade setup - no matter how many confluences align - is worth more than 1–2% of your trading capital.
At 2% risk per trade, you can sustain 50 consecutive losing trades. At 10% risk per trade, 10 losses end your account. Most traders who blow up don't have a strategy problem. They have a position-sizing problem.
Every Fibonacci confluence trade should offer a minimum 1:2 R:R ratio. Place your stop loss 3–5 pips ($3–$5 on Gold) beyond the 78.6% retracement level - not at the zone boundary. This prevents normal price volatility from stopping you out before the move develops.
🔑 KEY TAKEAWAYS
- ✓ A Fibonacci confluence zone is where a level aligns with at least one other signal (structure, EMA, trendline).
- ✓ The Golden Pocket (61.8%–66%) is the highest-probability reversal zone on XAUUSD.
- ✓ Always check the higher timeframe trend first. Trend is senior. Fibonacci is junior.
- ✓ Wait for a confirmed price action signal (pin bar, engulfing) before entering.
- ✓ Place stop losses beyond the 78.6% retracement to survive normal volatility.
Frequently Asked Questions
What is a Fibonacci confluence zone in trading?
A Fibonacci confluence zone is a price area where a Fibonacci retracement or extension level overlaps with one or more additional technical signals - such as a support or resistance level, a moving average, a trendline, or a candlestick pattern. The overlap creates a higher-probability reversal area because multiple independent systems are pointing to the same price zone simultaneously.
Why do Fibonacci confluence zones work on Gold (XAUUSD)?
Gold is a highly institutionalized market, with central banks, hedge funds, and algorithmic trading systems accounting for the majority of daily volume. These institutions use Fibonacci-based scaling algorithms to distribute large positions, meaning key Fibonacci levels - especially the Golden Pocket between 61.8% and 66% - consistently attract institutional order flow on XAUUSD.
What is the Golden Pocket in Fibonacci trading?
The Golden Pocket is the zone between the 61.8% and 66% Fibonacci retracement levels. It is considered the highest-probability reversal area in Fibonacci analysis because institutional algorithms cluster their buy orders in this range. It should never be traded without confirmation from a second confluence factor and a price action signal.
Conclusion
Fibonacci confluence zones don't require you to be smarter than the market. They require you to be more structured than 90% of the traders competing against you. The traders who succeed long-term on Gold aren't chasing every candle or reacting to every spike. They identify where institutional flow is most likely to accumulate, build a checklist of confluences that must align before they act, and then - critically - they wait.
Trading financial instruments involves substantial risk. The content on Fibonetics.com is for educational purposes only and not financial advice.
Share this article
Ready to Apply This?
Book a free 15-minute strategy call to identify your trading weaknesses and see how a structured Fibonacci framework applies to your trading.
Book My Free 15-Minute Strategy Call →